Adding a Box and Whisker Layer
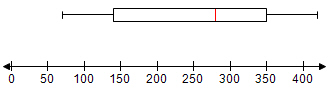
A box-and-whisker plot (or a box plot) is a histogram-like method of displaying data. The plot shows boxes to represent the quartile ranges, and whiskers (single lines) to the farthest points that are not outliers.
To add a box and whisker layer to a number line graph:
-
Insert a number line graph or edit an existing graph by double-clicking it. The Number Line Graph dialog box opens.
-
In the Layers section, click Add.
-
Select Box and Whisker in the Add Number Line Layer dialog box and then click OK.
-
Enter values for the Lower Extreme, Lower Quartile, Median, Upper Quartile, and Upper Extreme.
-
Enter an optional Label.
Note: You can format the text using HTML text. -
Select a Color for the graph.
-
If you want the layer to display only if a certain condition is met, enter an equation or a variable that evaluates to true or false into the Show if field.
Note: When entering variables, enclose the variable name in two opening and two closing number signs (for example, ##var1## = 3). The variable you reference must be defined for the question or the preface associated with the question. -
Click OK.