Adding Circle Layers
To add a circle to a Cartesian graph:
-
Insert a Cartesian graph or edit an existing graph by double-clicking it. The Cartesian Graph dialog box opens.
-
In the Layers section, click Add.
-
Select Circle in the Add Cartesian Layer dialog box and then click OK.
-
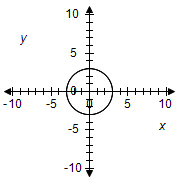
Enter the radius of the circle in the r field.
-
Specify the location of the center of circle by entering the x coordinate in the a field and the y coordinate in the b field. By default, the center is placed at (0,0).
-
Select a Line Style for the line.
-
Select a Line Color.
-
Select a Relation to specify how shading is applied to the graph.
Relation Shading = The outline of the figure is shaded. < The area within the figure is shaded. <= The outline and the area within the figure is shaded. > The area outside the figure is shaded. >= The outline and area outside the figure is shaded. -
Click Fill Color to specify the color of the shaded area of the graph.
-
Click Fill Shading to specify the pattern applied to the shaded area of the graph.
-
If you want the layer to display only if a certain condition is met, enter an equation or a variable that evaluates to true or false into the Show if field. .
Note: When entering variables, enclose the variable name in two opening and two closing number signs (for example, ##var1## = 3). The variable you reference must be defined for the question or the preface associated with the question. -
Click OK.