Adding a Normal Curve
To add a normal curve to a Cartesian graph:
-
Insert a Cartesian graph or edit an existing graph by double-clicking it. The Cartesian Graph dialog box opens.
-
In the Layers section, click Add.
-
Select Normal Curve in the Add Cartesian Layer dialog box and then click OK.
-
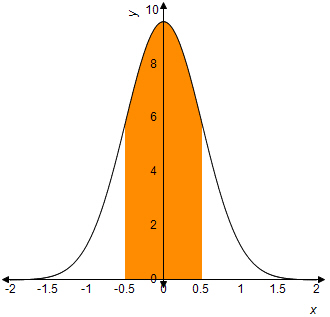
Enter the Mean and Standard Deviation for the curve. If you want the vertical axis to go through the mean, leave the mean value set to zero.
-
Enter the Scaling Factor.
-
If you want to shade part of the curve, enter the lower and upper limits in the Shading Starts and Shading End fields as multiples of the standard deviation.
-
Select a Line Style for the line.
-
Click the Line Color to specify the color of the curve.
-
Click Fill Color to specify the color of the shaded area of the graph.
-
Click Fill Shading to specify the pattern applied to the shaded area of the curve.
-
If you want the layer to display only if a certain condition is met, enter an equation or a variable that evaluates to true or false into the Show if field. .
Note: When entering variables, enclose the variable name in two opening and two closing number signs (for example, ##var1## = 3). The variable you reference must be defined for the question or the preface associated with the question. -
Click OK.