Adding Intersection Layers
To add an intersection to a Cartesian graph:
-
Insert a Cartesian graph or edit an existing graph by double-clicking it. The Cartesian Graph dialog box opens.
-
In the Layers section, click Add.
-
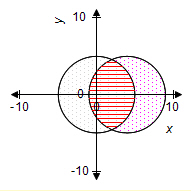
Select Intersection in the Add Cartesian Layer dialog box and then click OK.
-
Choose the graphs to which you want the intersection to apply.
Note: You must have at least two layers or graphs, and the selected graphs must have a Fill Color and Fill Shading specified. -
Choose a Color for the intersection area.
-
Select a pattern from the Shading list to specify the pattern applied to the intersection.
-
If you want the layer to display only if a certain condition is met, enter an equation or a variable that evaluates to true or false into the Show if field. .
Note: When entering variables, enclose the variable name in two opening and two closing number signs (for example, ##var1## = 3). The variable you reference must be defined for the question or the preface associated with the question. -
Click OK.