Adding Polynomial Layers
To add a polynomial to a Cartesian graph:
-
Insert a Cartesian graph or edit an existing graph by double-clicking it. The Cartesian Graph dialog box opens.
-
In the Layers section, click Add.
-
Select Polynomial in the Add Cartesian Layer dialog box and then click OK.
-
Choose a method to define the polynomial. You can choose from the following:
Points: A polynomial defined by coordinates that lie on the curve
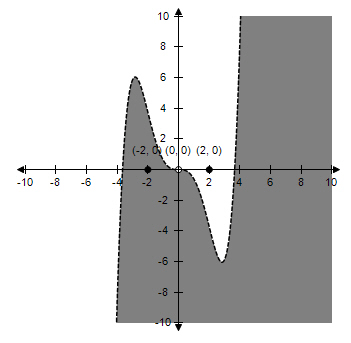
Zeroes: A polynomial defined by positions where the curve crosses the horizontal axis
Critical points: A polynomial defined by positions where the curve is parallel to the horizontal axis
Zeroes of the 2nd derivative: A polynomial defined by inflection points in the curve -
Enter the X values.
-
If you selected Points from the Definition list, enter the Y values.
-
For each point select a Style.
-
Enter an optional Label for each point.
Note: You can format the text using HTML text. -
If you entered a label select the Label Location.
-
Select Show coordinate to display the location of the point as (x, y).
-
Enter the Domain of the function. The default domain is from -Inf to Inf.
-
If you defined the polynomial as Zeroes, Critical Points, or Zeroes of the 2nd Derivative, enter the Scale to specify a multiplier to increase or decrease the size of the graph (for example, entering 2 doubles the size of the graph).
-
If you defined the polynomial as Critical Points or Zeroes of the 2nd Derivative, enter the Y Intercept.
-
If you defined the polynomial as Zeroes of the 2nd Derivative, enter the Slope at X = 0.
-
Select a Line Style for the line.
-
Select a Line Color.
-
Select a Relation to specify how shading is applied to the graph.
Relation Shading = The line is shaded. < The area below the curve is shaded. <= The line and the area below the curve is shaded. > The area above the curve is shaded. >= The line and area above the curve is shaded. -
Click Fill Color to specify the color of the shaded area of the graph.
-
Click Fill Shading to specify the pattern applied to the shaded area of the graph.
-
If you want the layer to display only if a certain condition is met, enter an equation or a variable that evaluates to true or false into the Show if field. .
Note: When entering variables, enclose the variable name in two opening and two closing number signs (for example, ##var1## = 3). The variable you reference must be defined for the question or the preface associated with the question. -
Click OK.