Adding Segments
To add line segments to a Cartesian graph:
-
Insert a Cartesian graph or edit an existing graph by double-clicking it. The Cartesian Graph dialog box opens.
-
In the Layers section, click Add.
-
Select Segment in the Add Cartesian Layer dialog box and then click OK.
-
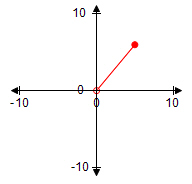
Enter the X and Y coordinates for the endpoints of the segment.
-
Select a Point Style for the endpoints.
-
Enter an optional Label for the endpoints.
Note: You can format the text using HTML text. -
If you entered a label select the Label Location.
-
Select Show coordinate to display the location of the endpoints as (x, y).
-
Click Line Style to format the line as solid or a variety of dashed styles.
-
Select a Color for the endpoints and line.
-
If you want the layer to display only if a certain condition is met, enter an equation or a variable that evaluates to true or false into the Show if field. .
Note: When entering variables, enclose the variable name in two opening and two closing number signs (for example, ##var1## = 3). The variable you reference must be defined for the question or the preface associated with the question. -
Click OK.