Adding Shapes
To add a shape to a Cartesian graph:
-
Insert a Cartesian graph or edit an existing graph by double-clicking it. The Cartesian Graph dialog box opens.
-
In the Layers section, click Add.
-
Select Shape in the Add Cartesian Layer dialog box and then click OK.
-
Select a Shape.
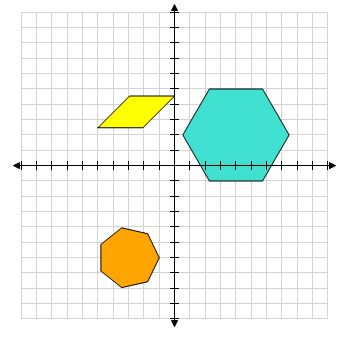
Available shapes include:-
Block
-
Cone
-
Cylinder
-
Grid
-
Heptagon
-
Hexagon
-
Octagon
-
Parallelogram (slanted to the right)
-
Parallelogram2 (slanted to the left)
-
Pentagon
-
Prism
-
Pyramid
-
Rectangle
-
Rhombus 45 (a rhombus with a 45° angle)
-
Rhombus 60 (a rhombus with a 60° angle)
-
Right Triangle (hypotenuse on the right, short side on the bottom)
-
Right Triangle 2 (hypotenuse on the left, short side on the bottom)
-
Right Triangle 3 (hypotenuse on the left, short side on the top)
-
Right Triangle 4 (hypotenuse on the right, short side on the top)
-
Sphere
-
Trapezoid
-
Triangle
-
-
Enter the Left and Top coordinates for the shape.
-
Enter the Width and Height of the shape. If you are creating a Block, enter the Depth.
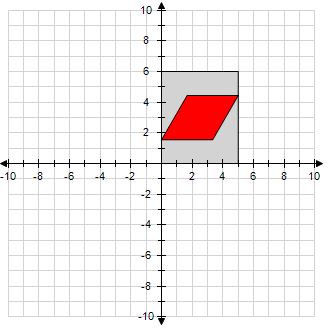
Note: The shape is contained in an area defined by the left/top coordinates and the width and height. The graphing tool creates the largest shape based on the width and then centers it in the defined area. The example below shows a 60° rhombus with the following values: Left (0), Top (6), Width (5), Height (6).
-
Select a Line Color.
-
Click Fill Color to specify the color of the shaded area of the graph.
-
Click Fill Shading to specify the pattern applied to the shaded area of the graph.
-
If you want the layer to display only if a certain condition is met, enter an equation or a variable that evaluates to true or false into the Show if field. .
Note: When entering variables, enclose the variable name in two opening and two closing number signs (for example, ##var1## = 3). The variable you reference must be defined for the question or the preface associated with the question. -
Click OK.